
Malgosia Ip, Mathematics & Statistics editor
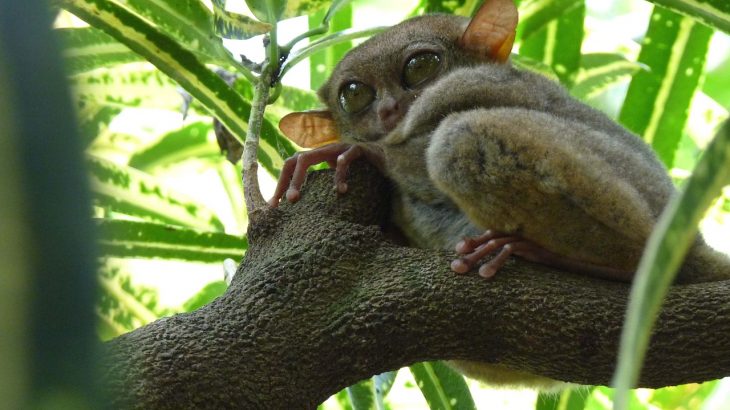
Meet the Philippine tarsier: a tiny primate with giant eyes that’s native to the Philippine archipelago. Despite its small size, this little fella has been the subject of controversy for over a century – is it more closely related to the lemur (a so-called “wet-nosed” primate) or to apes and humans (“dry-nosed” primates)? The tarsier has traits that fit into both categories: it has multiple pairs of nipples and grooming claws like lemurs, and large offspring and monthly menstruation cycles like humans.
Math might finally have an answer. Over the past three years, computer scientist Lila Kari and her groups at the University of Waterloo and Western University, along with her collaborators, have developed a mathematical approach to compare DNA from different species. This could make classifying species much more quantitative, saving species like the tarsier from taxonomic limbo. “Currently, [tarsiers] are classified as dry-nosed primates, but our method places them with the wet-nosed primates,” says Kari.
Kari’s approach starts with something called a chaos game representation (CGR), which transforms the sequence of adenine (A), cytosine (C), thymine (T), and guanine (G), nucleotides in your DNA, into a complex pattern of dots that looks more like a piece of art than a science project.
Try it yourself:
- Draw a square and label the corners A, C, T, and G. Now, place a dot at the centre of the square.
- Draw a line from the centre dot to the corner that corresponds to the first letter in your DNA sequence. Place a dot at the midpoint of that line (the lines themselves are not important; it’s the dots that matter).
- Draw a line from that dot to the corner corresponding to the next letter in the sequence and place a dot at the midpoint of that line.
- Continue like this until you reach the end of your sequence and voila – your very own CGR of DNA!
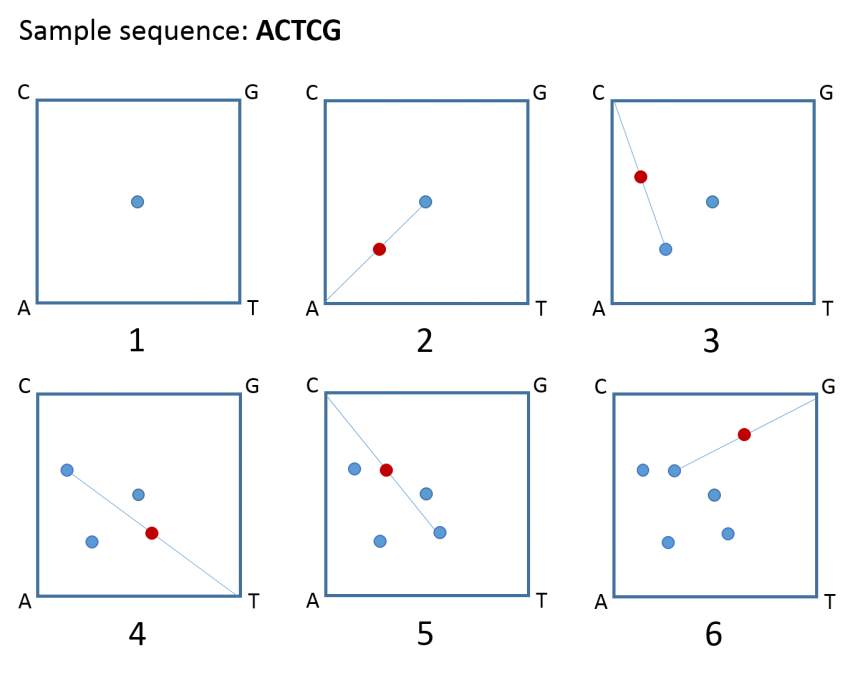
A chaos game representation (CGR) of the sequence ACTCG. Image credit: Malgosia Ip
Of course, genomic DNA usually contains millions of nucleotides, so the resulting diagrams are much more striking. Given enough dots, you start to see unique and characteristic motifs like lines, triangles, or crosses – like a species-specific QR code. Human mitochondrial DNA looks like a series of triangles, whereas red algae’s looks like stripes. Though every species’ CGR is unique (just like their DNA), the CGRs of closely related species tend to be more similar to each other.
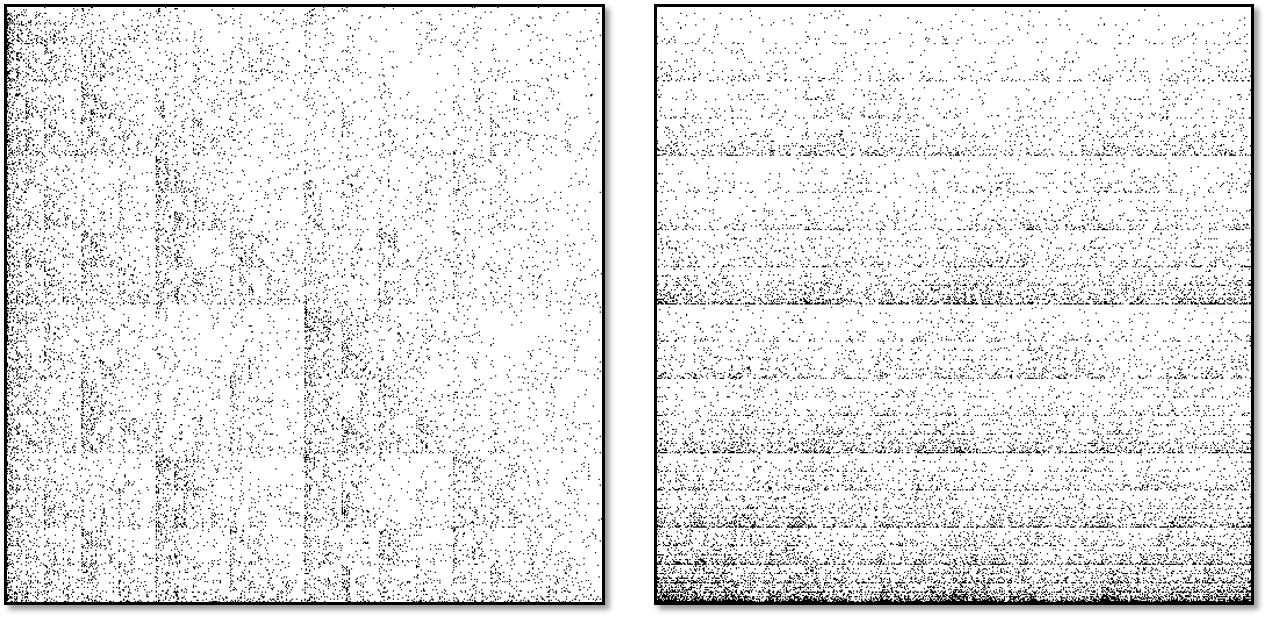
CGRs for human mitochondrial DNA (left) and red algae mitochondrial DNA (right). Image credit: Lila Kari
By calculating the mathematical “distance” between these images and then using a statistical method called multi-dimensional scaling, each DNA sequence can be transformed into a single point in 3D space. The closer these points are to each other, the more similar the genomes they represent.
“It’s like turning the tree of life into the map of life,” explains Kari.
Unlike classic phylogenetic trees that only tell you the relationships between species on the same branch, a map gives you more information, showing the relationships between all species simultaneously.
When Kari’s group tried the method on a collection of over 1,700 vertebrate mitochondrial genomes, the result was a 3D plot with clusters that corresponded remarkably well with current species classification. See for yourself in the image below or in this interactive version.
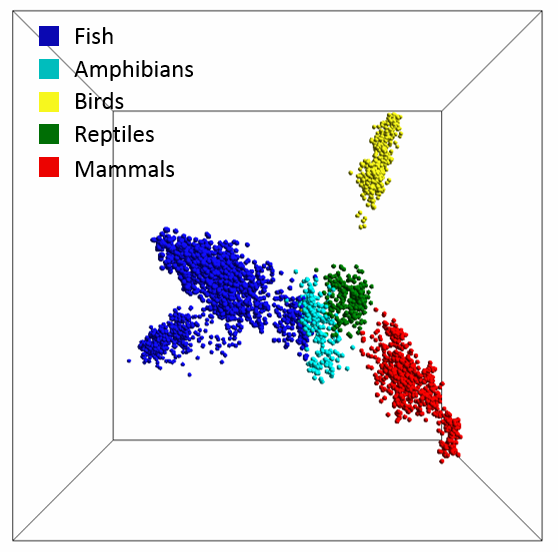
The map of life for vertebrates created using Kari’s mathematical method for genome comparison. Image credit: Lila Kari
Even species that crept over the boundaries still appeared logically placed, like a species of fish with primitive lungs that slid into the amphibian cluster, or a snake-like amphibian that snuck into the reptile cluster. And, of course, the tarsier, which sits with the wet-nosed primates.
“The fact that this method captured common characteristics – I thought that was the coolest thing,” says Kari. Especially because the method doesn’t care at all about what kinds of sequences you’re comparing or where they came from.
Currently, species classification relies on a combination of data, from an assessment of morphological traits to DNA sequence alignment to molecular information. Of these, DNA sequence alignment comes the closest to being a quantitative measure of species relatedness, but it relies on the presence of a reference gene or sequence that can be used as a point of comparison. But what about species that don’t have that particular gene? This is not an issue using Kari’s method.
“As a mathematician, this was the most attractive feature: it’s so universal. [The DNA] doesn’t need to be the same species or the same genus. It can be a computer-generated sequence or alien DNA from outer space, I don’t care. Bring it on!”
And in many cases, you don’t even need the entire genomic sequence for the method to work. Sometimes as little as a few percent of the sequence was enough to distinguish between two species. This means that the method could be used with raw sequencing data or for organisms where only low-quality sequencing results are available. Kari makes sense of this by thinking about the whole genome as a book – you don’t need to read the whole book to know which one it is – but the biological reasons for why it works are yet to be uncovered.
That’s where Kari hopes collaborations with biologists can help. She currently has two on the go at Western University: one with Dr. David Smith who specializes in protists, and another with Dr. Art Poon, an HIV researcher.
Rather than replacing current classification methods, Kari’s sees this mathematical approach as complementary. With such a computationally efficient, scalable method (you can compare 20 or 20,000 sequences) and some raw sequencing data, we could much more quickly classify the estimated 86 per cent of species on Earth and 91 per cent of species in the ocean that don’t yet have a home in the tree of life.
And we could do it without any tarsier-sized controversies.