By Auriel Fournier, Mathematics and Statistics Editor
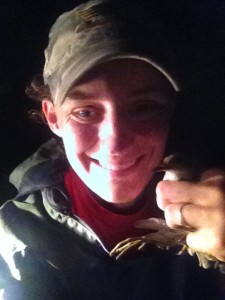
Auriel Fournier with the first Sora of the 2014 field season. (Photo credit: Auriel Fournier)
Ecology often comes down to counting something and using those counts to answer a question. We count birds, we count offspring, we count individuals with diseases, and we count the parasites that harass them. Counting things sounds simple, and if we could be sure we were counting everything all the time it would be. But reality is rarely that simple.
My dissertation is about counting rails, which are really cool wetland birds. We mainly focus on Sora (Porzana carolina), a bird that can be found across much of North America depending on the time of year. Many wetlands are managed to provide habitat for waterfowl (read: ducks and geese). I am trying to understand how that impacts rails, which also use and live in the same wetlands. Many rails, including Sora, are declining, and we need to understand which habitats they use before we can understand how to conserve the wetlands.
A lot of what I do involves trying to figure out how many rails there actually are based on our estimates, and then seeing how the number of rails varies in different kinds of wetlands during migration.
But counting anything, rails included, has an additional layer of difficulty related to detection (i.e., seeing them when they are there). Rails are difficult to detect even when they are there, because they are hard to see or hear. So we have to design our survey methods to give us the best chances of seeing a rail when it is there. That requires knowing a great deal about their natural history. Where do they live? When are they active? How do they respond to different kinds of stimuli? This requires experimentation, trial and error, and tweaking.
During fall migration, when I do my fieldwork, rails spend most of their time walking around in dense wetland vegetation on their big, snowshoe-like feet, eating to get the energy they need to make their next migratory flight. They rarely vocalize, and don’t often fly.
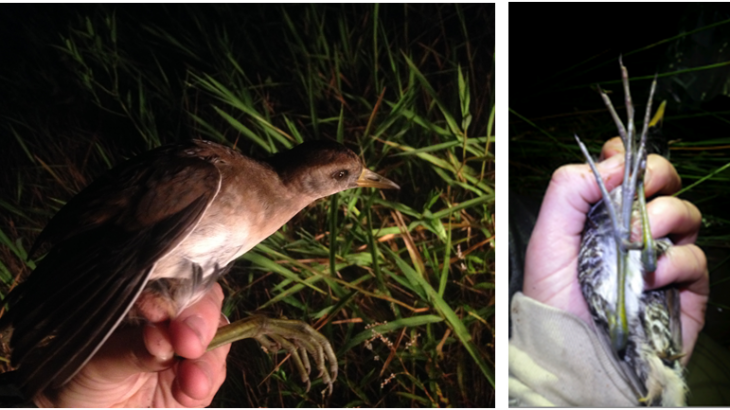
Sora are about 19–30 cm long and weigh 50–110g. Their feet are very large for their body size. The Sora on the right is perfectly fine, just upside down at the moment it was photographed. (Photo credit: Auriel Fournier)
To detect them, you have to get out into the wetland and look. During the day, they’ll often just run away before you can see them. But if you go out at night, it’s a different story. When we approach them on ATVs (All Terrain Vehicles, or four-wheelers or quads or quadbikes, whatever term you prefer) at night, they flush out of their hiding places into the air and fly short distances. This lets us count and identify them. This video will give you some idea what it’s like.
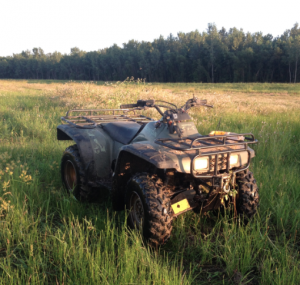
An ATV getting ready for a long night of surveying. (Photo credit: Auriel Fournier)
To count them, we measure how far away from our driving path the bird was when it flushed. We can use these data, and some cool models, to figure out how many rails there are and what kinds of wetlands they like to use.
This is based on the idea that the farther away something is from you the harder it is to detect. We can use what is called a hierarchical model to estimate how many rails are in a given wetland. This model allows us to estimate two things at the same time: probability of detection, and density. Our chances of seeing a bird go down when that bird is farther away. That chance is called detection probability.
It is the curse of everyone who studies rails because they are very difficult to find, in part because they are very well camouflaged and also because they spend most of their time walking around in dense vegetation. Your chances of seeing a bird decrease the farther away you are from the bird. How fast your chances drop off varies from place to place and species to species. For example, you are much more likely to detect a really big bird (like an egret) from farther away than you are a really small one (like a sparrow).
The second thing, density, is the number of birds in a given area. There are two ways we can model this. We can run a model with no habitat information and get estimates of rail density based on our counts (So, how many rails are in this wetland anyway?). Or we can use the habitat layer of our model to look at how density changes between different wetlands (Do wetlands with deeper water have more rails? Do wetlands with more grasses have more rails?). In my current work, I look at the impact of water depth on rail density. Are there more rails in deeper water? Does rail density increase to a certain point and then decrease again? What about plants? Do rails use areas with lots of certain kinds of plants? These are the kinds of questions that our models allow us to ask and find answers to.
Without models that take detection into account, it becomes very, very difficult to understand what kinds of habitats rails – or any other organisms – use. You wouldn’t be able to tell the difference between a 0, a place that really has no rails, and a false 0, a place where you see no rails even though they’re there. By modeling detection, we can try to account for this, which lets us ask more fully developed questions and better account for the error around our estimates.
Accurately estimating the size of a population when you can’t count every individual is never easy. In ecology it is often impossible, or at least totally impractical, to try and count them all. But that is part of the challenge and requires us to understand the habitat or the species we are studying in detail. By using models to turn rough field counts into more realistic estimates, we can better understand the organism we are studying and see the world around us in new and exciting ways.
My work has shown the kinds of habitats, types of plants, and water depths rails select during migration, and how rail density changes as those things change. Our research will be used by local and federal agencies to manage wetlands for all species and improve our understanding of rail migration. And the next time we count rails, we’ll know where and when to look for them.


