Mika McKinnon, Math & Statistics editor
Canadians love numbers. We mourned the loss of the long-form census, and celebrated its return by filling it out in record-breaking numbers. But Statistics Canada does a lot more than just the census. Here are eight more ways numbers tell stories about life in Canada.
-
Spotting migration patterns.
When Canadians head south of the border, their most common destinations are California (19.3%) and Florida (18.1).
-
Telling the sweet story of honey.
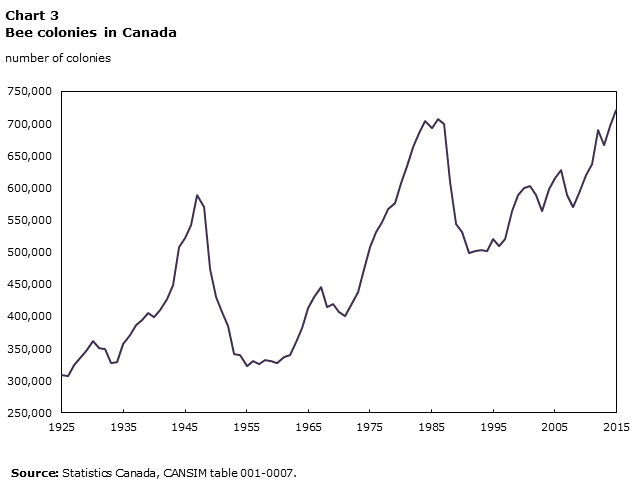
Beekeeping has a complicated history in Canada, surging with the war effort to produce wax for ammunition belts, crashing with varroa mites plague, and oscillating in the present day.
-
Tracking the spread of new technologies in old industries.
Statistics Canada monitors how industry adopts innovative technologies and techniques. For example, every year, more industries are learning the value of geographical information systems for their businesses. The strongest adopters of using GPS in their work are utility companies with 43.9% of companies embracing the technology, followed by forestry and logging (36.5%), transportation and warehousing (36.1%), and finally mining, quarrying, and oil and gas extraction (31.1%).
-
Embracing a story of immigration.
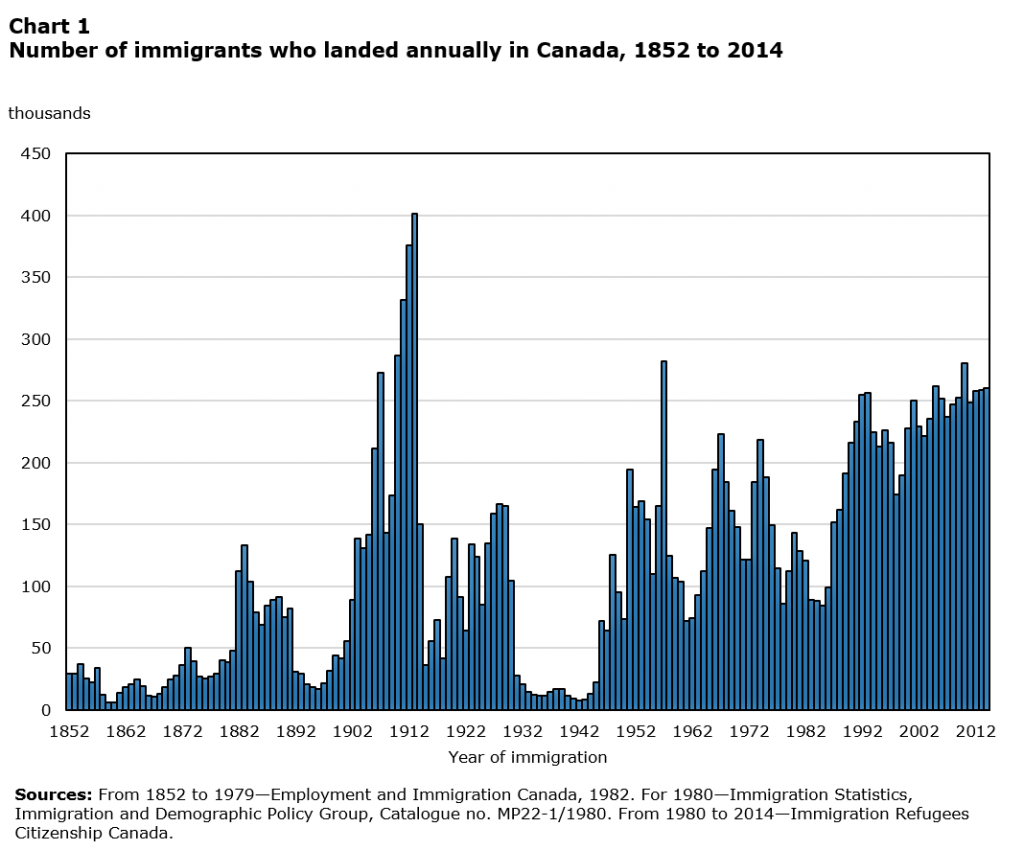
Over 17 million immigrants have come to Canada since Confederation in 1867, with changing patterns of their country of origin and number each year.
In the early 1900s, a push to colonize Western Canada pushed immigration to an all-time high of more than 400,000 people in 1913 primarily from Europe. Smaller immigration peaks pair up with political and humanitarian crises: 37,500 Hungarian refugees came to Canada between 1956 and 1957, while large numbers of refugees from Uganda, Chile, Vietnam, Cambodia, and Thailand came to Canada in the 1970s and 1980s. World War I and II sharply curtailed immigration.
-
Measuring how Canadians are getting energy.
Canada generated 631.7 million megawatt hours (MWh) of electricity in 2015, a 0.3% increase over 2014 electrical generation. Most of the electricity was from hydraulic turbines (59.2%), followed by combustible fuels (22.1%), nuclear fission (15.1%), and renewable energy including wind, solar, and tidal power generation (3.6%).
Electricity generated by burning thermal fuels dropped 1.2% compared to previous years to a total of 211.6 million megawatt hours (MWh). Of the fuels burned, uranium and coal dropped (5.0% and 0.4% respectively) while natural gas rose (6.2%). The use of natural gas went down (4.7% commercially and 6.4% residentially), with refined petroleum also having a slight decline (0.3%).
The production of crude oil and natural gas increased in 2015 while market value sharply dropped. This is part of a larger trend over the last decade where production and transportation are becoming more sophisticated in response to market demand. Increasing production has follow-on impacts to other Statistics Canada surveys — the oil and gas section produces a quarter (26%) of Canada’s 732 megatonnes of greenhouse gas emissions.
-
Mapping the growth of cities.
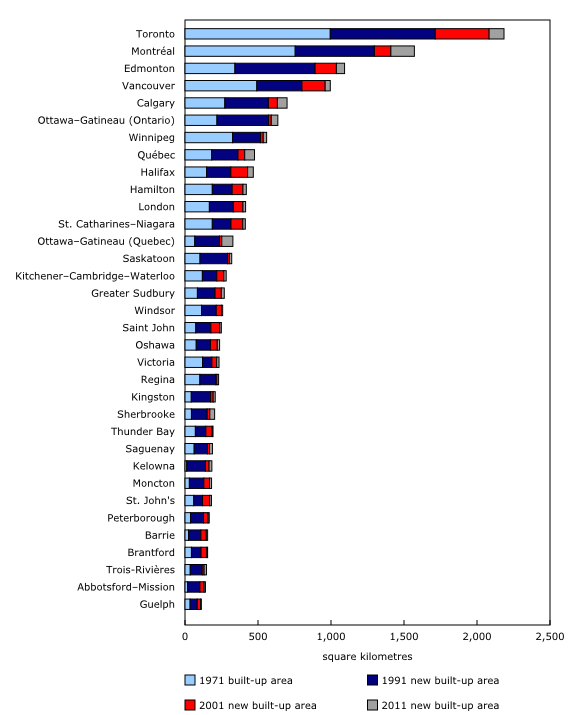
Statistics Canada has been mapping the boundaries of urban areas with a dataset now stretching from 1971 to 2011 as they nearly doubled in size.
Sources: Statistics Canada
-
Identifying problems facing Canadians.
Canadians are producing more garbage now than in the past with a 27% increase in tonnes of waste between 2002 and 2012 and up another 2% by 2014, but are also diverting more of that waste out of landfills. Most of this diverted waste is surplus, obsolete, or broken electronics.
Sometime this e-waste is tracked by what goes missing from the numbers: in 2013, roughly half of Canadian households had surplus audio-visual equipment; 26% had an unwanted television; 24% had an unwanted television; and nearly as many had an extra cellphone. Just over half the larger appliances were disposed of at an e-waste drop-off centre or depot, but under a quarter of cellphones were disposed of the same way. We look forward to learning if LED lightbulbs will follow the patterns of TVs and computers, or end up in landfills like cellphones.
-
Eyeing death.
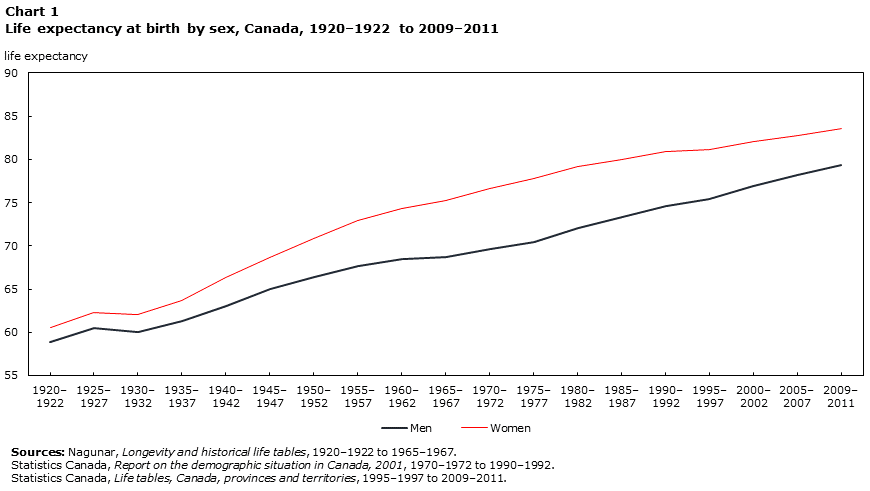
Life expectancies are climbing in Canada, with people born in 2009-2011 expected to live more than twenty years longer than those born in 1920-22. Meanwhile, causes of death are also changing. People are less likely to die from injuries or respiratory system illnesses, and more likely to die from cancer. Since the mid-1990s, deaths from infectious diseases and parasites has been starting to climb.
Believe in the value of data? Canada is hiring a new Chief Science Advisor! Apply by January 27, 2017 to advocate for data-driven policy, communicate scientific discoveries, and protect intellectual freedom of government scientists.
Header image: Pixabay CC0



Love the stats and these graphs are incredibly interesting, even though they don’t really have much to do with me and my major. Simply love a good well put-together case study! Fantastic job!